Hello tseriz: Data With a Known Answer
Every data-driven project I've worked on has started the same way, a hunt for data.
When working complexn data-driven problems data is almost always scarce or hard to get. Say you are working on a vibration signals that describe equipment failures. Or a pressure sensor data set with a transient at a known moment. Or twenty correlated channels with a sensor dropout somewhere in the middle, so you can find out whether your gap-filler actually works. Multiple sensors with data quality issues that need cleaning and validation before using them for training machine learning models or being labeled “AI ready”
What you find is either a small subset of data with a few events and lots of baseline information, a data dump of NDA-locked export from a customer and a wall of bureaucracy and layers of technology to access the full dataset or the live feed, or three days (less now with AI) of your own life spent writing disposable scripts that you'll throw away next month.
So I built the thing I kept wishing existed. It's called TSERIZ.
What it is
TSERIZ turns a plain-English description into a realistic, physics-grounded time series. It has many physics-grounded (e.g. oscillation, vibration, transients) and digital signal processing-based features (e.g. white/pink/brown noise) to generate time series (timestamped data), and I plan on adding more as it evolves.
You have two options: use the signal configuration sidebar to enter specific parameters, or simply describe what you need in plain language to generate the data.
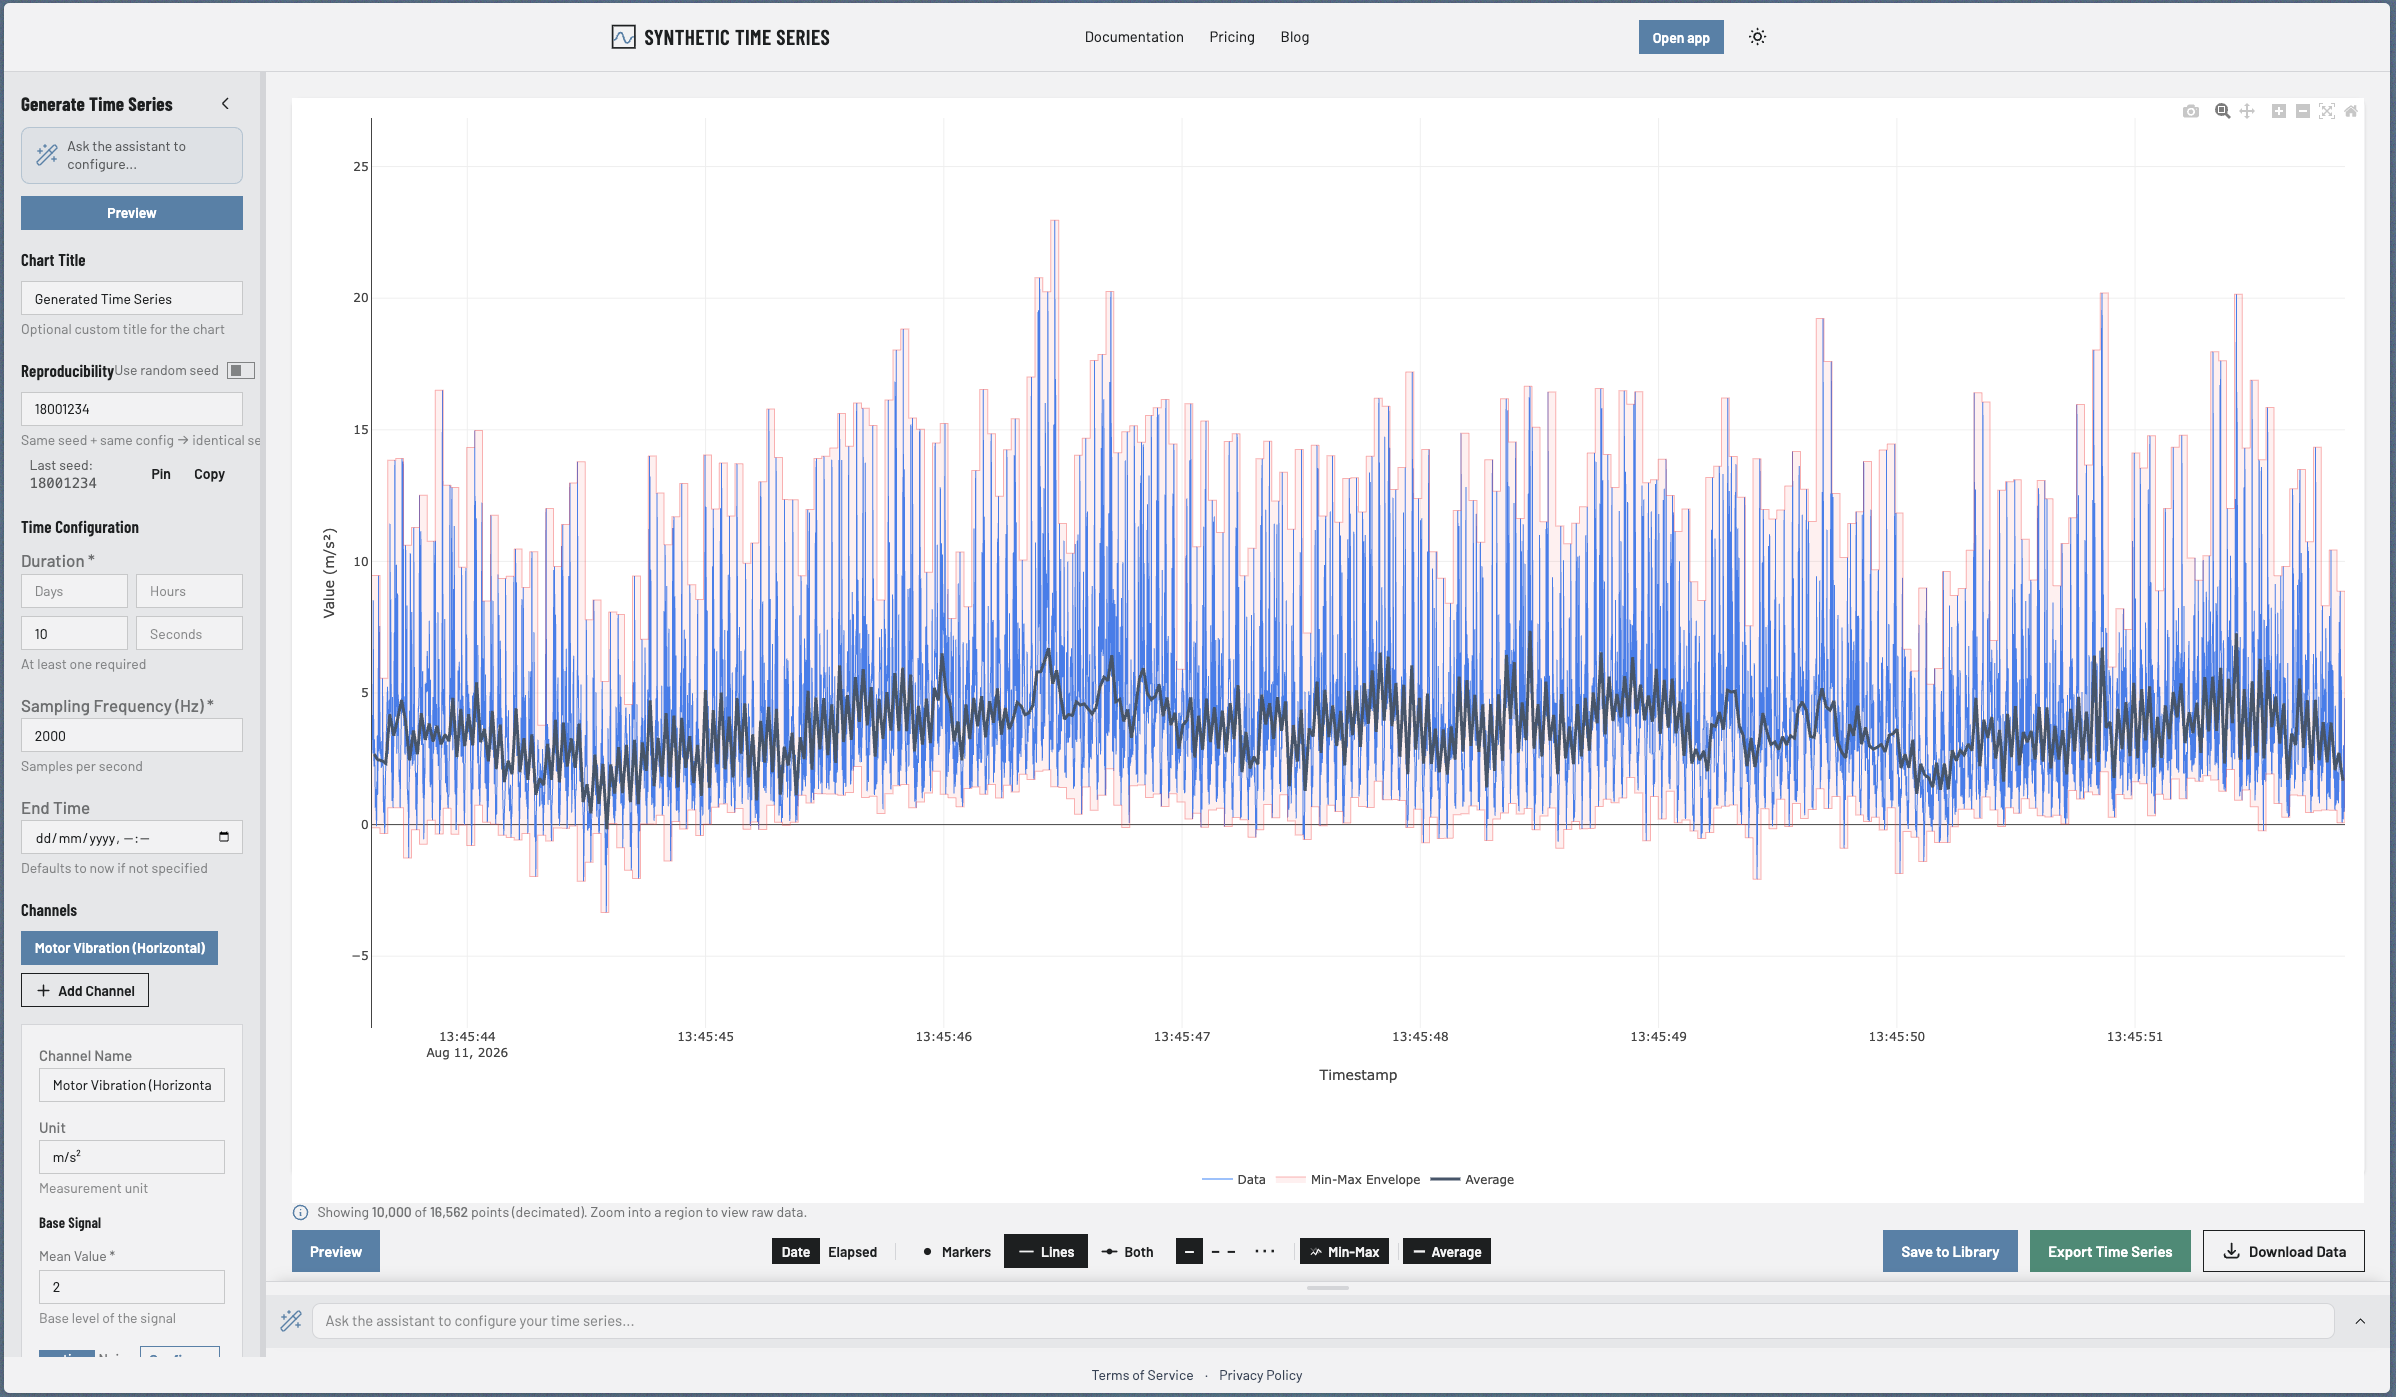
Simulate a motor at 1800 RPM with light bearing wear over 2 hours
The result is not a black box. The assistant translates your description into an explicit, editable configuration: channels, sampling rate, noise model, oscillations, transients, correlations, degradation, gaps, outliers. Every knob is exposed. If the assistant guessed something you don't like, you can change it manually and regenerate. The end result is that you know the ground truth and It's reproducible; you defined the signal, so you know exactly what's in it and same config, same seed, same data.
Where to use it
The engine is built around the things that make real sensor data hard: damped transients, coloured noise, drift, correlated channels, missing data. I built it for the areas I typically work in, industrial data science and scientific work.
Predictive maintenance & rotating machinery. A motor at a set RPM with harmonics and a growing bearing signature. Generate the healthy baseline and the degraded case, and find out how early your detector actually fires. "4 seconds at 512 Hz, 30 Hz fundamental plus harmonics, light bearing wear."
Process & condition monitoring. Pump trips, valve slams, thermal drift on a bearing over a shift. The damped second-order impulse is a first-class citizen here — onset, natural frequency, damping ratio, amplitude — so a valve slam rings and decays the way one actually does.
Seismic & event detection. Multi-phase arrivals with realistic ringing and decay, for tuning pick algorithms against events whose arrival times you already know.
Multi-sensor arrays. Channels that genuinely share a physical process, correlated anywhere from −1 to +1. Useful when you're testing whether a model has learned the relationship between sensors or just memorised one of them.
Data pipeline & fault-tolerance testing. Contiguous outages, sensor dropouts, outlier sweeps. Point them at your ingestion pipeline before production does it for you. This is the use case people are usually most surprised by, and the one I hear about most.
ML training data. Labeled series at volume for pre-training and augmentation — especially for the failure modes you have three examples of in the real world.
Benchmarking. Reproducible fixtures with a known answer, so "the new model is better" becomes a number rather than a vibe.
Finance and business metrics. A little further from home, but the primitives fit: autoregressive noise, volatility that clusters, drift, weekly and daily seasonality, spikes. Good for stress-testing anomaly detectors and dashboards on synthetic revenue, latency, or traffic. Less good for anything claiming to model real market microstructure.
Signal Fidelity
Aliasing guardrails. A Nyquist frequency check runs before generation, in the browser as you edit, on the server at validation, and in the AI agent's own self-check. You don't discover at analysis time that your 60 Hz component was sampled at 50 Hz and is now a beautiful, entirely fictional 10 Hz signal.
A stricter rule for transients. Nyquist is the right bound for an oscillation, whose whole waveform matters. A transient is judged by its peak, and a peak is one point on a curve. TSERIZ enforces 10 samples per natural period, because at 4 the rendered peak comes out ~30% low and at 2 it can come out at 1% of amplitude with the wrong sign. You get a warning below 10 and an error below 4.
Real noise models. White, pink and brown, summed as independent components. Each with its own amplitude, AR(1) autocorrelation and heteroscedasticity. A vibration sensor is white electronic noise plus a correlated pink mechanical baseline plus brown drift. Real sensors don't produce Gaussian white noise and your synthetic data should strive to simulate real conditions.
Second-order transients. Impulse and step responses from natural frequency and damping ratio, with correct underdamped, critically damped and overdamped closed forms. Use these to simulate valve slams, seismic P/S arrivals, structural ringing, setpoint changes.
Oscillatory events with tapers. Oscillations can start and stop mid-series, to simulate events such as a compressor surge, cavitation, a control loop going unstable and then recovering. A raised-cosine taper fades the envelope at the edges to avoid injecting a step discontinuity that your changepoint detector will legitimately flag in addition to the fault you meant to create.
Correlated multi-channel. Up to 10 channels with pairwise correlations from −1 to +1, applied via Cholesky decomposition. Very useful for simulating multiple sensor data that share a physical process (e.g. pressure and temperature readings at the inlet/outlet of a compressor).
Sine, sawtooth and triangle. Counters, accumulators and odometers wrap; reciprocating machinery zig-zags. Plus modulo wrapping for anything that rolls over.
Realistic failure modes
Missing data that looks like missing data. Scattered dropouts, contiguous outages, or both at a ratio you choose. These data quality issues are common in historians (e.g. isolated dropouts and multi-minute signal gaps).
Outliers with intent. Introduce outliers as constant value, random range, or a multiplicative factor with sign control. Real data always has outliers.
Ghost data. A stretch where the sensor's true dynamics get duplicated onto a constant-offset rail, same shape, same noise realisation, shifted vertically. Useful for simulating redundant collector pairs with a calibration mismatch, backfill overlap after an outage, tag aliasing. Three modes available: whole-signal step, a bounded block, or two interleaved coexisting rails.
Windowed degradation. Bad data is often temporary. Add data degradation features to the signal using confined time windows for gaps, outliers and ghosts. For example, "20% missing data points between t=300 and t=400".
Reproducibility
Seeds that actually reproduce. Use seeding to achieve identical results run after run. Same config plus same seed gives bit-identical data. The seed is a uint32, validated at every entry point (form, REST serializer, database column, and the AI's emitted config).
The config is the artifact. Every run persists its validated config and resolved seed. A saved series can be replayed, forked, or handed to a colleague as a few lines of JSON.
Natural language in, editable parameters out. Describe the signal; the assistant writes the config, explains its reasoning, and hands you the JSON. It's not a black box, every parameter lands in the form where you can override it. The assistant also sees your live form state, so "make it noisier" adjusts your configuration rather than regenerating something new underneath you.
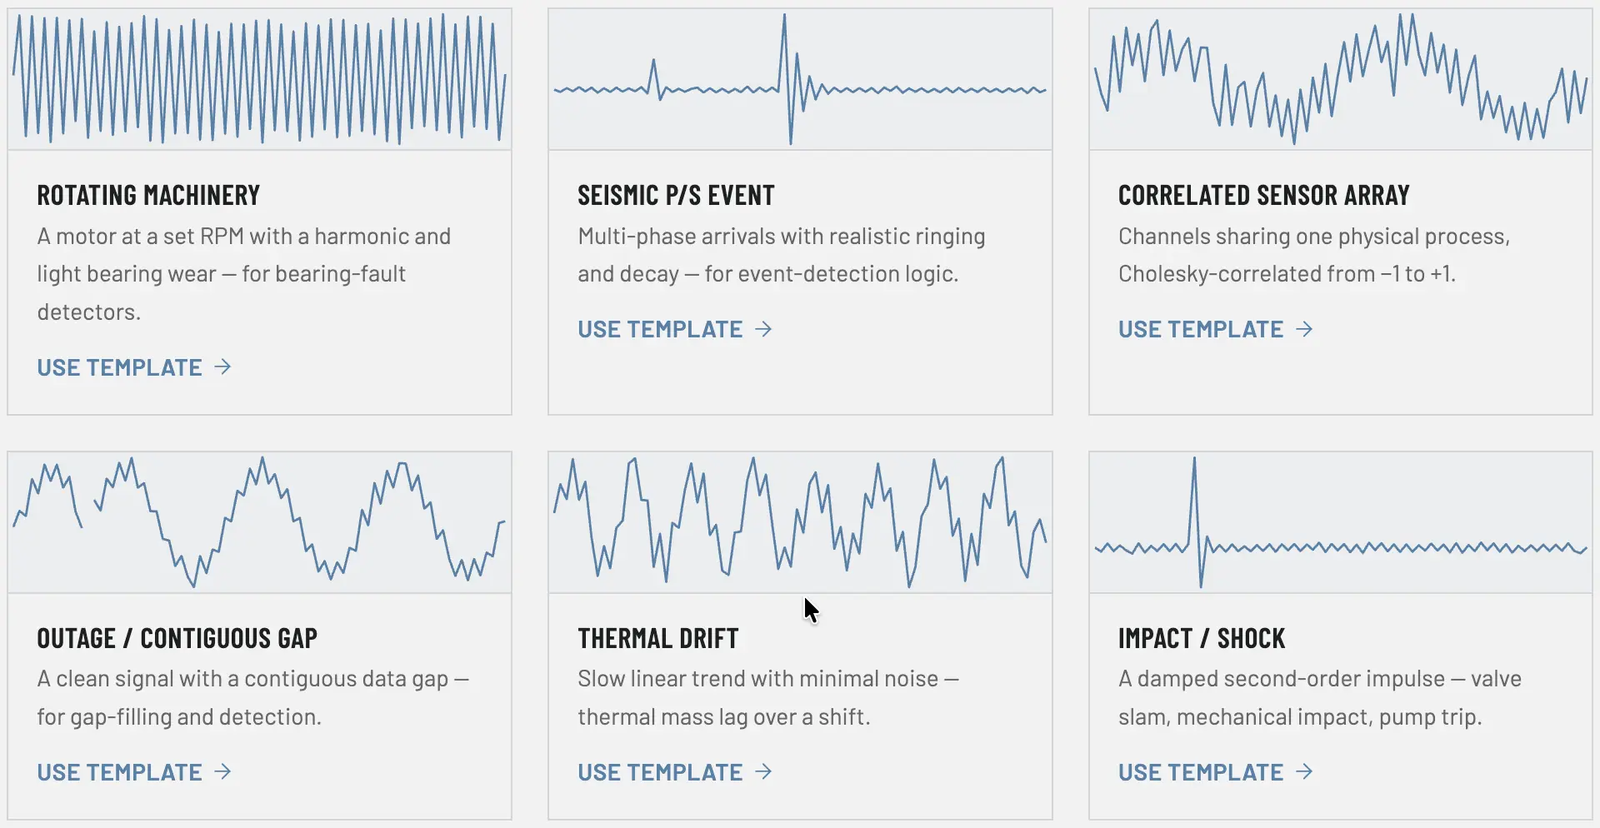
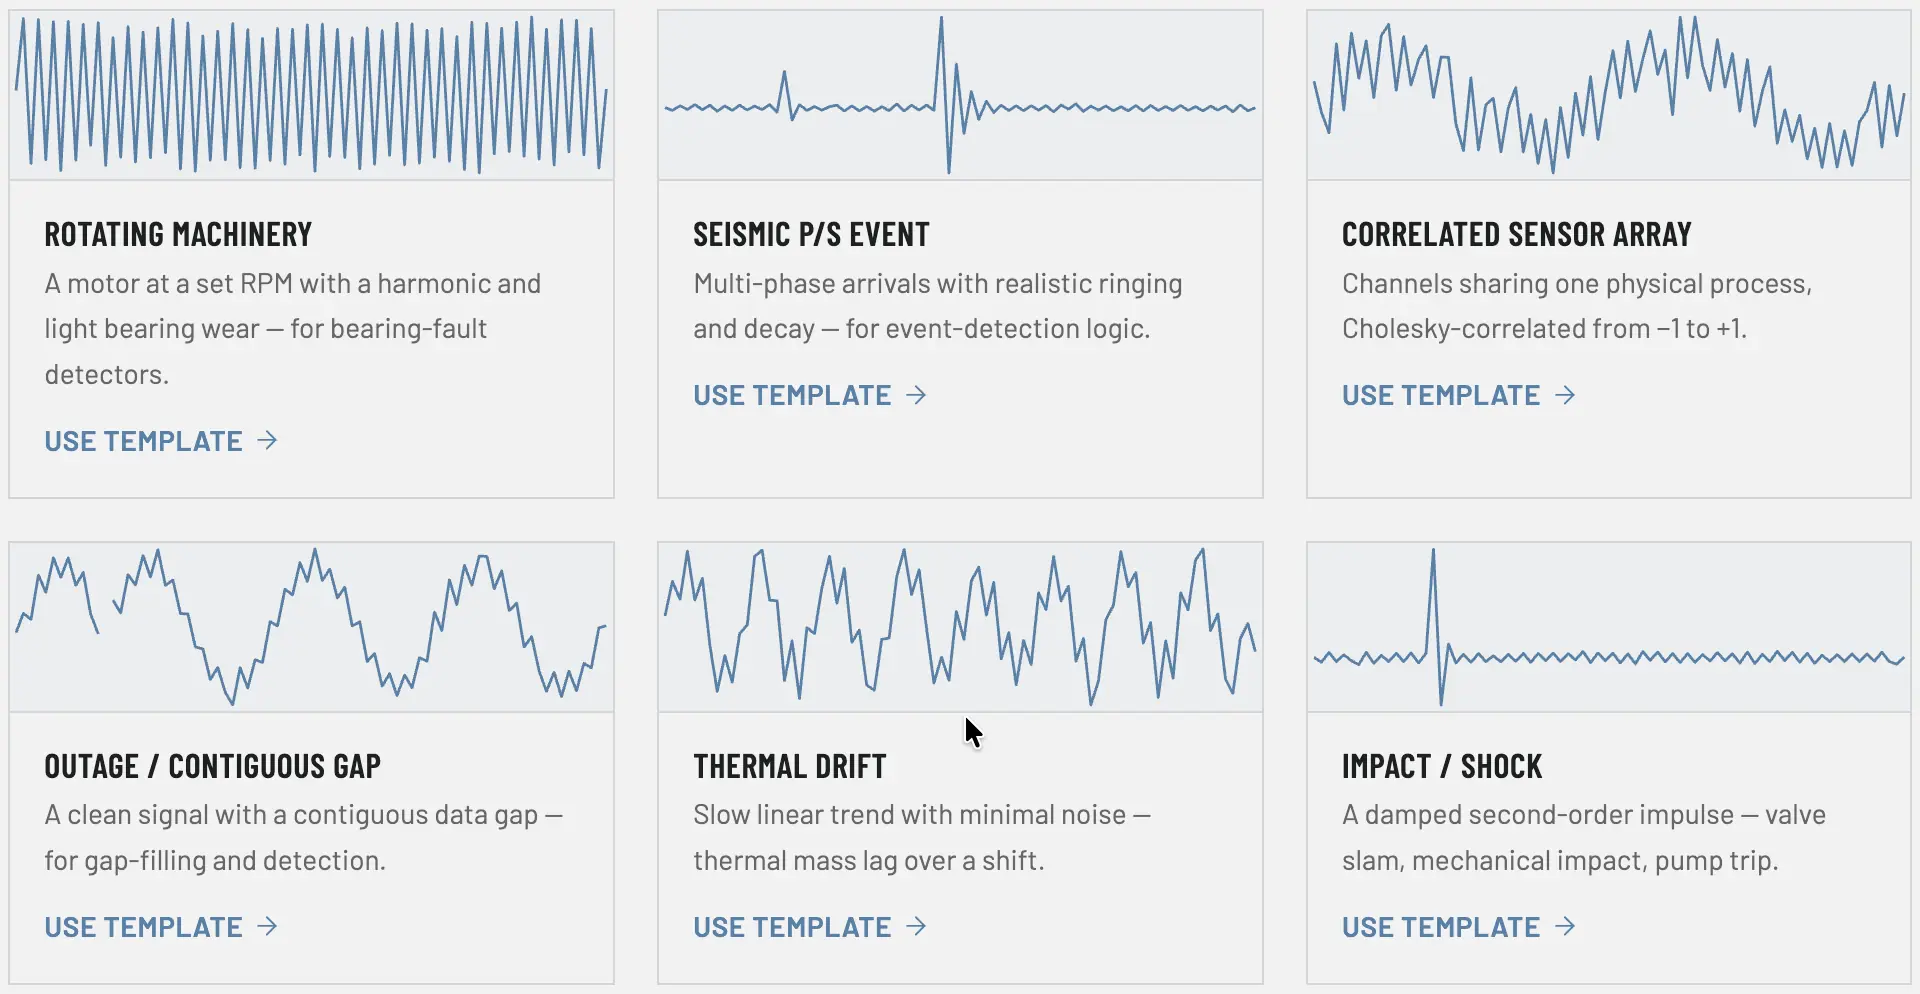
Worked examples that are real. When you enter the application for the first time, there are several presets. These will take you to the actual generated series. Click one and you're editing a working config and can use it as a template.
Scale and visualisation
Large data sets rendering. The application uses the well-know LTTB downsampling to preserve visual features that naive sampling hides, and a min-max envelope overlay to feature the extreme data points.
Zoom re-fetches real data. The full series is cached server-side and zooming in pulls the underlying resolution when viewing <5000 data points.
Get your data out
Export in multiple formats. CSV, Excel and JSON, plus direct writes into your own InfluxDB bucket. There's a REST API too, so this can live inside a CI job rather than a browser tab.
Scoped API keys. Separate scopes for generating, reading history and writing to InfluxDB, so the key in your test runner can't read your account and the key in your notebook can't write to production.
Generate time series safely
Validate before you spend. A dry-run endpoint checks a config without consuming AI tokens before a “bad” generation.
Async for the big ones. Large runs return a generation you poll as a real resource with a stable ID and status.
Credentials handled properly. InfluxDB tokens are encrypted at rest and never returned in any response, including to you.
Organisation
Library of time series. Saved series live in projects with names, descriptions and thumbnails; rename, move, re-download in any format, or reopen the conversation that produced them.
Visible usage. Generations used, credits remaining, calls per day, and the exact date your allowance resets before you hit the wall.
Try it
There's a free tier. Sign up and generate your first synthetic time series or start from one of the examples: rotating machinery, seismic P/S event, impact shock, thermal drift, correlated sensors, an outage gap.
I'd genuinely like to know what breaks, what's missing, and what scenario you tried to describe that the assistant fumbled. That feedback is the roadmap right now.
More posts coming. I want to do a deep dive into a field I am interested in, predictive maintenance (PdM), and use TSERIZ to generate synthetic data that would improve a PdM model.